ファイル:BenfordNarrow.gif
ナビゲーションに移動
検索に移動
高解像度版はありません。
BenfordNarrow.gif (401 × 132 ピクセル、ファイルサイズ: 5キロバイト、MIME タイプ: image/gif)
概要
| 解説 |
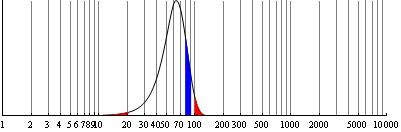
English: A narrow probability distribution plotted on a log scale, to demonstrate a case where Benford's law does not hold. This is to be contrasted with BenfordBroad.gif. |
| 原典 | 投稿者自身による著作物 |
| 作者 | Sbyrnes321 |

|
このグラフ画像は、ベクターイメージである SVG ファイルとして再作成されるべきです。これにはいくつかの利点があります。詳しくはCommons:Media for cleanupを参照してください。この画像の SVG 形式がすでに利用可能である場合は、アップロードしてください。アップロード後、この画像にあるこのテンプレートを{{Vector version available|新しい画像ファイル名.svg}}テンプレートで置き換えてください。
|
ライセンス
| この作品の著作権者である私は、この作品についての権利を放棄しパブリックドメインとします。これは全世界で適用されます。 一部の国では、これが法的に可能ではない場合があります。その場合は、次のように宣言します。 私は、あらゆる人に対して、法により必要とされている条件を除き、如何なる条件も課すことなく、あらゆる目的のためにこの著作物を使用する権利を与えます。 |
(* Source code written in Mathematica 6.0, by Steve Byrnes, 2008. I release this code into the public domain. *)

LabelsList = {1, 2, 3, 4, 5, 6, 7, 8, 9, 10, 20, 30, 40, 50, 70, 100, 200, 300, 500, 1000, 2000, 5000, 10000};
LineList = {1, 2, 3, 4, 5, 6, 7, 8, 9, 10, 20, 30, 40, 50, 60, 70, 80, 90, 100, 200, 300, 400, 500, 600,
   700, 800, 900, 1000, 2000, 3000, 4000, 5000, 6000, 7000, 8000, 9000, 10000};

gg[xx_] := Exp[-Abs[(xx - 60)/25]^1.8] xx

firstdig1[xx_] :=
  (1 < xx && xx < 2) || (10 < xx && xx < 20) || (100 < xx && xx < 200) || (1000 < xx && xx < 2000);
firstdig8[xx_] :=
  (8 < xx && xx < 9) || (80 < xx && xx < 90) || (800 < xx && xx < 900) || (8000 < xx && xx < 9000);

plotB = LogLinearPlot[{gg[x], If[firstdig1[x], gg[x], 0], If[firstdig8[x], gg[x], 0]}, {x, .995, 10100},
  Ticks -> {LabelsList, {}}, PlotRange -> All, TicksStyle -> Directive[Black, 10],
  GridLines -> {LineList, {}}, ImageSize -> 401, AspectRatio -> .3,
  Filling -> {2 -> Bottom, 3 -> Bottom}, PlotPoints -> 1000, PlotStyle -> {Black, Red, Blue},
  FillingStyle -> {2 -> Red, 3 -> Blue}]

Export["plotB.gif", plotB, ImageSize -> 500]
ファイルの履歴
過去の版のファイルを表示するには、その版の日時をクリックしてください。
| 日時 | サムネイル | 寸法 | 利用者 | コメント | |
|---|---|---|---|---|---|
| 現在の版 | 2009年7月8日 (水) 22:46 | 401 × 132 (5キロバイト) | wikimediacommons>Sbyrnes321 | Changed scale to facilitate easier comparison with BenfordBroad.gif |
ファイルの使用状況
以下のページがこのファイルを使用しています: