ファイル:LogisticMap BifurcationDiagram.png
ナビゲーションに移動
検索に移動
このプレビューのサイズ: 800 × 566 ピクセル。 その他の解像度: 320 × 226 ピクセル | 640 × 453 ピクセル | 1,024 × 724 ピクセル | 1,280 × 905 ピクセル | 1,838 × 1,300 ピクセル。
元のファイル (1,838 × 1,300 ピクセル、ファイルサイズ: 571キロバイト、MIME タイプ: image/png)
概要
| 解説 |
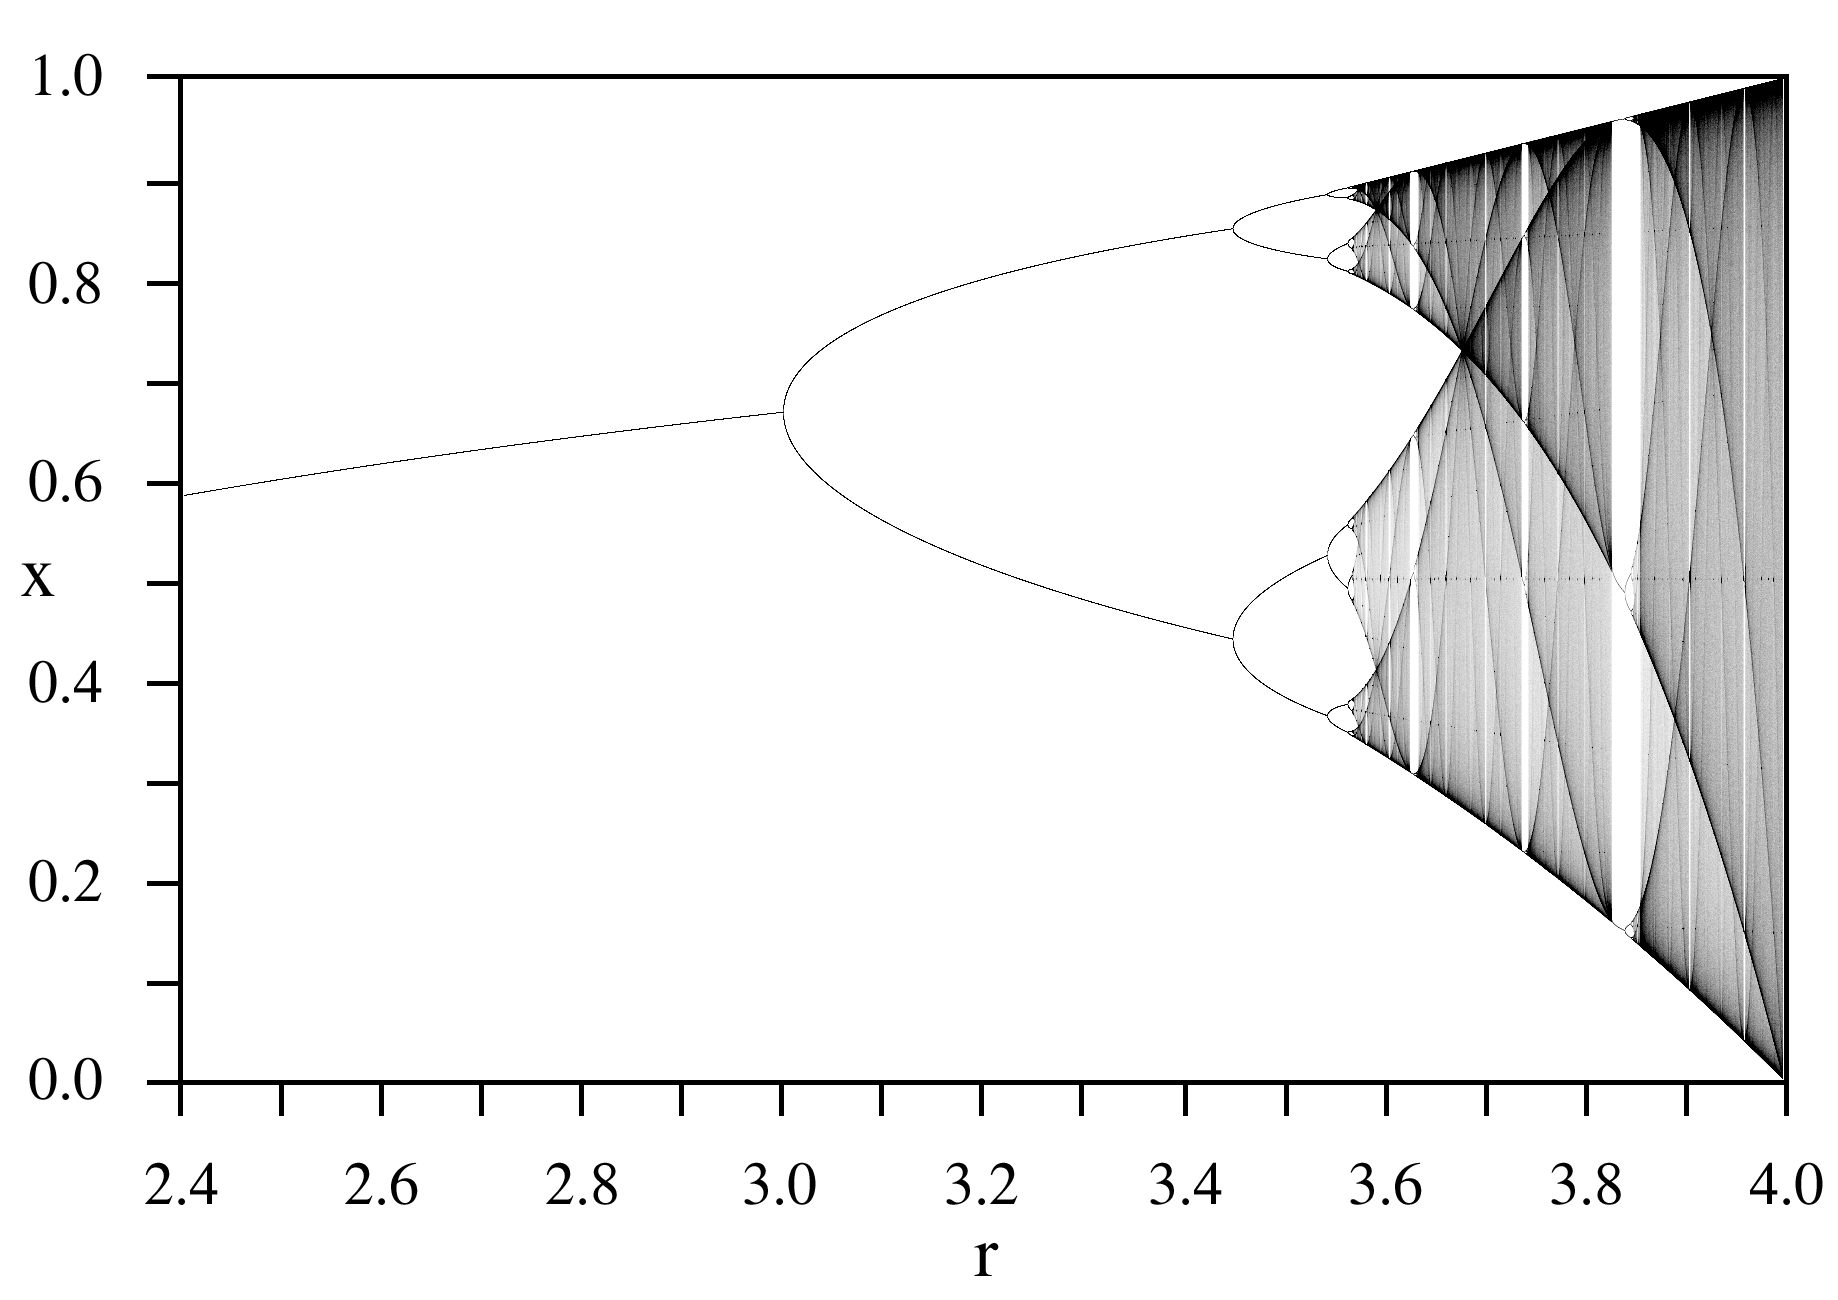
English: A bifurcation diagram for the Logistic map:
|
| 日付 | |
| 原典 | 投稿者自身による著作物 |
| 作者 | PAR |

ライセンス
| この作品の著作権者である私は、この作品についての権利を放棄しパブリックドメインとします。これは全世界で適用されます。 一部の国では、これが法的に可能ではない場合があります。その場合は、次のように宣言します。 私は、あらゆる人に対して、法により必要とされている条件を除き、如何なる条件も課すことなく、あらゆる目的のためにこの著作物を使用する権利を与えます。 |

|
この画像は、ベクターイメージである SVG ファイルとして再作成されるべきです。これにはいくつかの利点があります。詳しくはCommons:Media for cleanupを参照してください。この画像の SVG 形式がすでに利用可能である場合は、アップロードしてください。アップロード後、この画像にあるこのテンプレートを{{Vector version available|新しい画像ファイル名.svg}}テンプレートで置き換えてください。
|
ファイルの履歴
過去の版のファイルを表示するには、その版の日時をクリックしてください。
| 日時 | サムネイル | 寸法 | 利用者 | コメント | |
|---|---|---|---|---|---|
| 現在の版 | 2005年9月14日 (水) 01:11 | | 1,838 × 1,300 (571キロバイト) | wikimediacommons>PAR~commonswiki | Bifurcation diagram for the logistic map for parameter r=2.4 to 4.0. |
ファイルの使用状況
以下のページがこのファイルを使用しています: