ファイル:Normal subgroup illustration.png
ナビゲーションに移動
検索に移動
このプレビューのサイズ: 624 × 600 ピクセル。 その他の解像度: 250 × 240 ピクセル | 499 × 480 ピクセル | 648 × 623 ピクセル。
元のファイル (648 × 623 ピクセル、ファイルサイズ: 48キロバイト、MIME タイプ: image/png)
en.wikipedia からコモンズに Maksim によって移動されました。
元のファイルページはこちら。以下の利用者は全てen.wikipediaに属します。

|
このファイルのベクター画像 (SVG) が利用できます。 使う目的に対し、元画像よりもSVGがより優れている場合、SVG画像を使用して下さい。
File:Normal subgroup illustration.png → File:Normal subgroup illustration.svg
|
 |
概要
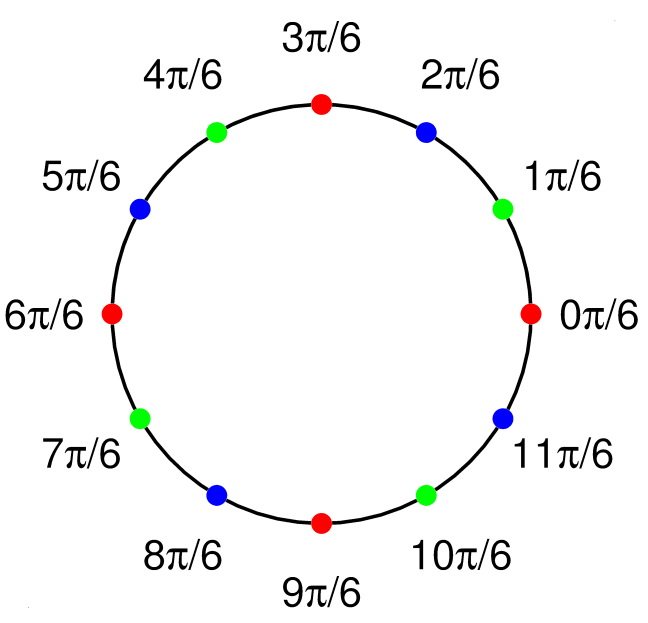
Made by myself with Matlab
ライセンス
| この作品の著作権者である私は、この作品についての権利を放棄しパブリックドメインとします。これは全世界で適用されます。 一部の国では、これが法的に可能ではない場合があります。その場合は、次のように宣言します。 私は、あらゆる人に対して、法により必要とされている条件を除き、如何なる条件も課すことなく、あらゆる目的のためにこの著作物を使用する権利を与えます。 |
Source code
function main ()

N=12; line_thickness=2.2; font_size=25; d=0.13; big_rad=10; ball_rad=0.5; ii=sqrt(-1);
red=[1, 0, 0]; green=[0, 1, 0]; blue=[0, 0, 1];
All=[red' green' blue'];

figure(1); clf; hold on; axis equal; axis off;

Theta=0:0.1:3*pi;
X=big_rad*cos(Theta);
Y=big_rad*sin(Theta);
plot(X, Y, 'linewidth', line_thickness, 'color', [0 0 0]);

for i=0:(N-1)
   z=big_rad*exp(i*ii*2*pi/N);
   place_text_smartly (z, font_size, i, d, sprintf('%d\\pi/%d', i, N/2), N);
   color_ball(real(z), imag(z), ball_rad, All(:, mod(i, 3)+1)');
end

scale=1.4;plot(scale*big_rad,  scale*big_rad)
scale=-1.4;plot(scale*big_rad,  scale*big_rad)

saveas(gcf, 'Normal_subgroup_illustration.eps', 'psc2')
saveas(gcf, 'Normal_subgroup_illustration.png')

function place_text_smartly (z, font_size, pos, d, tx, N)
 p=cos(2*pi/N)+sqrt(-1)*sin(2*pi/N);
 z = z + p^pos * d * font_size;
 shiftx=0.0003; shifty=0.03;
 x = real (z); y=imag(z);
 H=text(x+shiftx*font_size, y+shifty*font_size, tx);
 set(H, 'fontsize', font_size, 'HorizontalAlignment', 'c', 'VerticalAlignment', 'c')

 function color_ball(x, y, r, color)
    Theta=0:0.1:2*pi;
    X=r*cos(Theta)+x;
    Y=r*sin(Theta)+y;
    H=fill(X, Y, color);
    set(H, 'EdgeColor', 'none');
| date/time | username | edit summary |
|---|---|---|
| 13:19, 27 October 2005 | en:User:Oleg Alexandrov | (<span class="autocomment"><a href="/wiki/Image:Normal_subgroup_illustration.png#Source_code" title="Image:Normal subgroup illustration.png">→</a>Source code</span>) |
| 13:10, 27 October 2005 | en:User:Oleg Alexandrov | (<span class="autocomment"><a href="/wiki/Image:Normal_subgroup_illustration.png#Licensing" title="Image:Normal subgroup illustration.png">→</a>Licensing -</span> source code) |
| 12:42, 27 October 2005 | en:User:Oleg Alexandrov | (Made by myself with <a href="/wiki/Matlab" title="Matlab">Matlab</a>) |
元のアップロードログ
Legend: (cur) = this is the current file, (del) = delete this old version, (rev) = revert to this old version.
Click on date to download the file or see the image uploaded on that date.
- (del) (cur) 13:18, 27 October 2005 . . en:User:Oleg_Alexandrov Oleg Alexandrov ( en:User_talk:Oleg_Alexandrov Talk) . . 648x623 (49214 bytes) (Made by myself with Matlab.)
ファイルの履歴
過去の版のファイルを表示するには、その版の日時をクリックしてください。
| 日時 | サムネイル | 寸法 | 利用者 | コメント | |
|---|---|---|---|---|---|
| 現在の版 | 2006年3月20日 (月) 17:30 | | 648 × 623 (48キロバイト) | wikimediacommons>Maksim | La bildo estas kopiita de wikipedia:en. La originala priskribo estas: == Summary == Made by myself with Matlab == Licensing == {{PD-self}} == Source code== <pre><nowiki> function main () N=12; line_thickness=2.2; font_size=25; d=0.13; big_rad=10; |
ファイルの使用状況
このファイルを使用しているページはありません。