ファイル:Partition of unity illustration.svg
ナビゲーションに移動
検索に移動

この SVG ファイルのこの PNG プレビューのサイズ: 800 × 132 ピクセル. その他の解像度: 320 × 53 ピクセル | 640 × 106 ピクセル | 1,024 × 169 ピクセル | 1,280 × 211 ピクセル | 2,560 × 422 ピクセル | 5,400 × 891 ピクセル。
元のファイル (SVG ファイル、5,400 × 891 ピクセル、ファイルサイズ: 12キロバイト)
概要
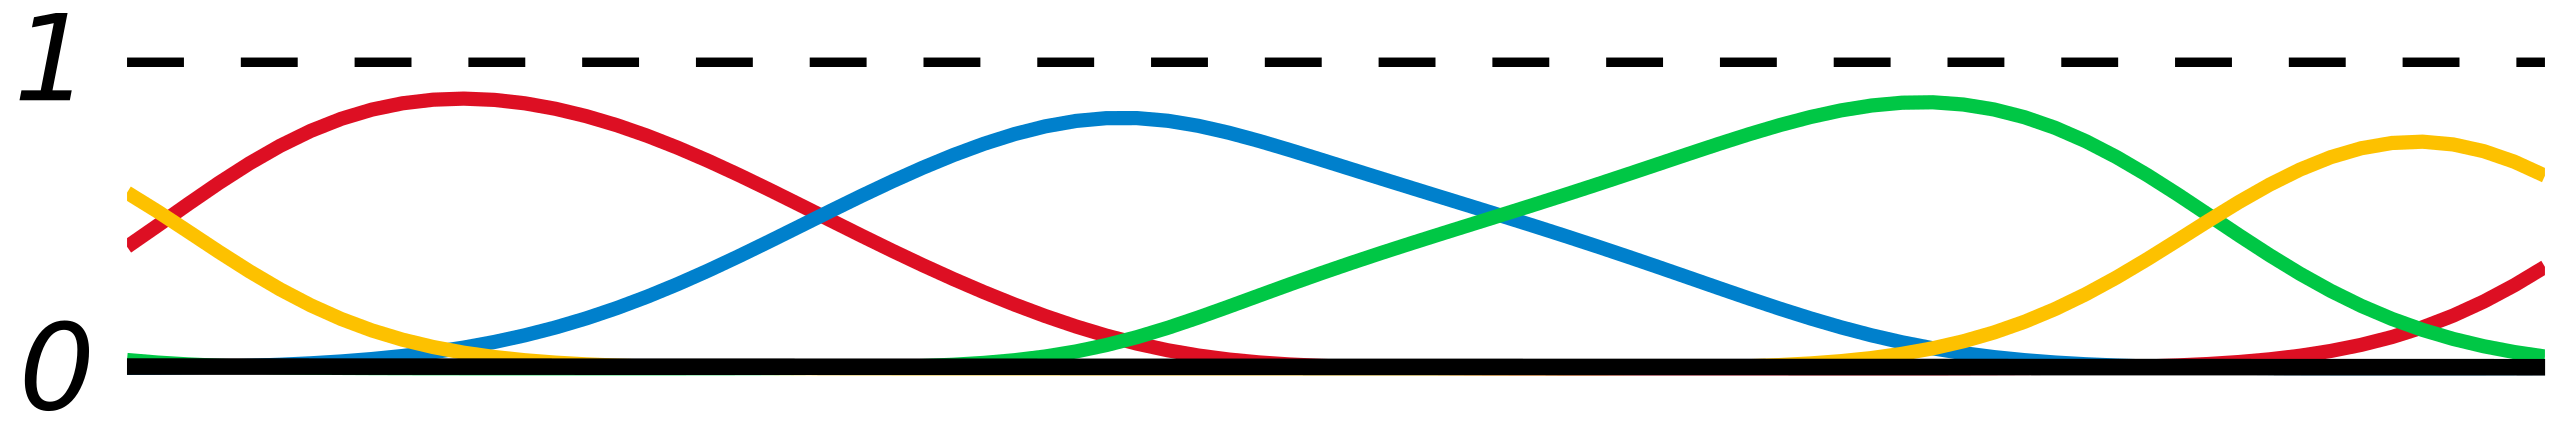
| 解説 | Illustration of Partition of unity |
| 日付 | (UTC) |
| 原典 | self-made with MATLAB, tweaked in Inkscape |
| 作者 | Oleg Alexandrov |
| SVG 開発 |
ライセンス
| この作品の著作権者である私は、この作品についての権利を放棄しパブリックドメインとします。これは全世界で適用されます。 一部の国では、これが法的に可能ではない場合があります。その場合は、次のように宣言します。 私は、あらゆる人に対して、法により必要とされている条件を除き、如何なる条件も課すことなく、あらゆる目的のためにこの著作物を使用する権利を与えます。 |
Source code (MATLAB)
% illustration of partitition of unity.
% For simplicity, we cheat by using scaled sums of gaussians
% instead of bump functions.

function main()

   figure(1); clf; hold on; axis equal; axis off;
   lw = 2; % linewidth

   h=0.1; % grid size

%  endpoints of the interval
   a = -5; b = 10;

   Sample=[-2.1 -1.3 -0.4 1.3 1.8 3.1 4.5];

   red    = [0.867 0.06 0.14];
   blue   = [0, 129, 205]/256;
   green  = [0, 200,  70]/256;
   yellow = [254, 194,   0]/256;
   Colors = [red', blue', green', yellow']';

   L = [2 4 6 8];

   X=a:h:b;
   Y = zeros(length(L), length(X));
   Yt = 0*X;

   % gaussian with mean zero variance zsigma
   zsigma=0.55;
   f=inline('exp(-x.^2/2/zsigma)/zsigma/sqrt(2*pi)');

   pos = 1;
   for i=1:length(Sample)

      if i > L(pos)
         pos = pos+1;
      end

      Ycur = f(X-Sample(i), zsigma);
      Y(pos, :) = Y(pos, :) + Ycur;
      Yt = Yt+Ycur;

   end

   [Xtp, Ytp] = make_periodic (a, b, h, X, Yt);
   Yr = 0*Xtp;

   for pos=1:length(L)
      [Xp, Yp] = make_periodic (a, b, h, X, Y(pos, :));

      Yp = Yp./Ytp;
      Yr = Yr + Yp;
      plot(Xp, Yp, 'color',  Colors(pos, :), 'linewidth', lw);
   end

   plot(Xtp, 0*Yr, 'k', 'linewidth', lw);
   plot(Xtp, Yr, 'k', 'linewidth', lw/1.4, 'linestyle', '--');

   fs = 20;
   shiftx = -0.3;
   shifty = -0.0;

   text(Xtp(1)+shiftx, 0+shifty, '0', 'fontsize', fs);
   text(Xtp(1)+shiftx, 1+shifty, '1', 'fontsize', fs);

   saveas(gcf, 'Partition_of_unity_illustration.eps', 'psc2');
   %plot2svg('Partition_of_unity_illustration.svg');

function [Xp, Yp] = make_periodic (a, b, h, X, Y)

%  Take a function defined on the real line.
%  Wrap the real line around. Sum the overlapping parts.
%  Get a periodic function.

   T = 8;
   as = -3; bs = as+T;
   A = (as-a)/h;
   B = (bs-a)/h;

   N = length(Y);

   Y((B-A+1):B) = Y((B-A+1):B) + Y(1:A);
   Y((A+1):(A+N-B)) = Y((A+1):(A+N-B)) + Y((B+1):N);

   Yp = Y((A+1):B);
   Xp = X((A+1):B);
ファイルの履歴
過去の版のファイルを表示するには、その版の日時をクリックしてください。
| 日時 | サムネイル | 寸法 | 利用者 | コメント | |
|---|---|---|---|---|---|
| 現在の版 | 2007年8月9日 (木) 05:03 | 5,400 × 891 (12キロバイト) | wikimediacommons>Oleg Alexandrov | Fix bug |
ファイルの使用状況
以下のページがこのファイルを使用しています: